Let's do it together!
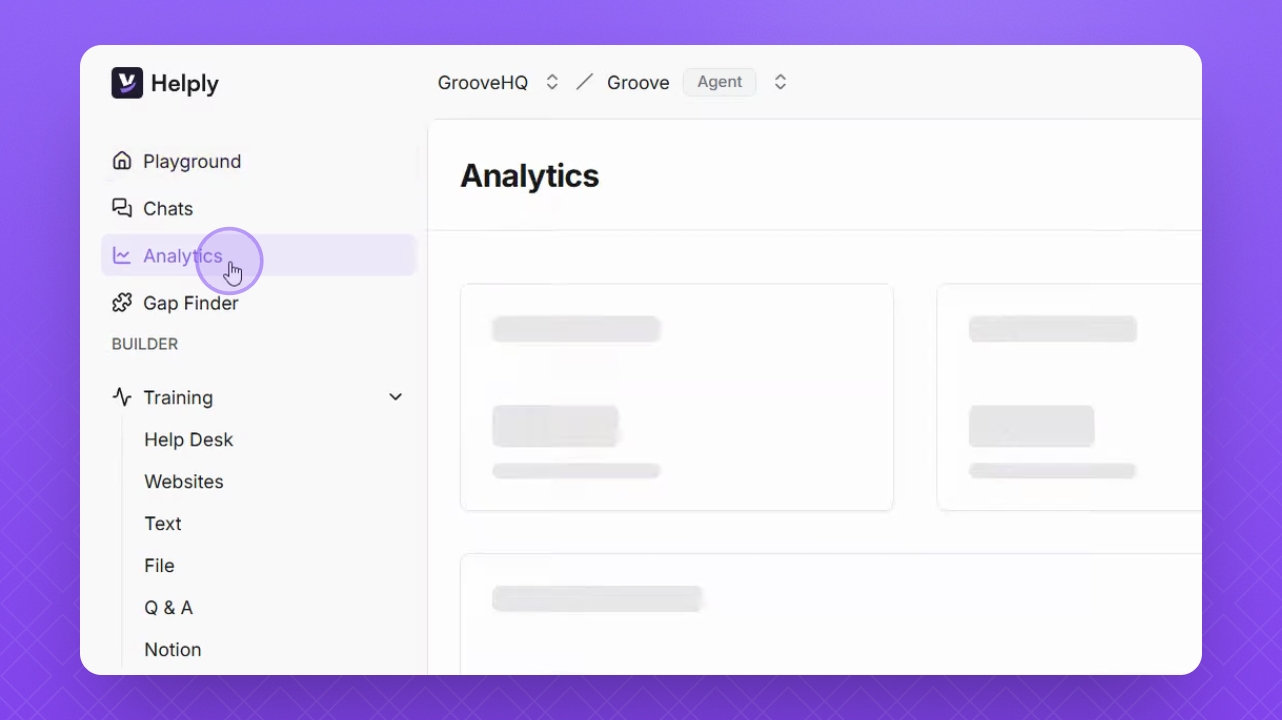
Step 1: Open Analytics
Navigate to the Analytics section on the left to access performance metrics.
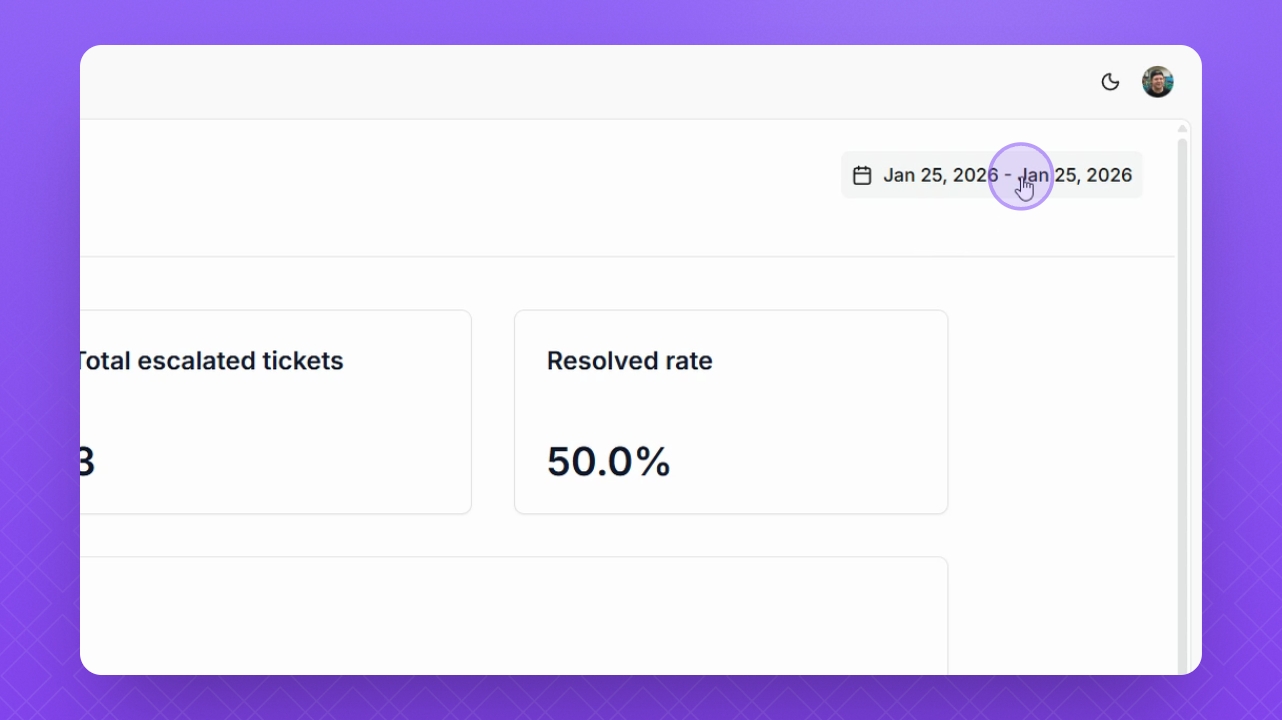
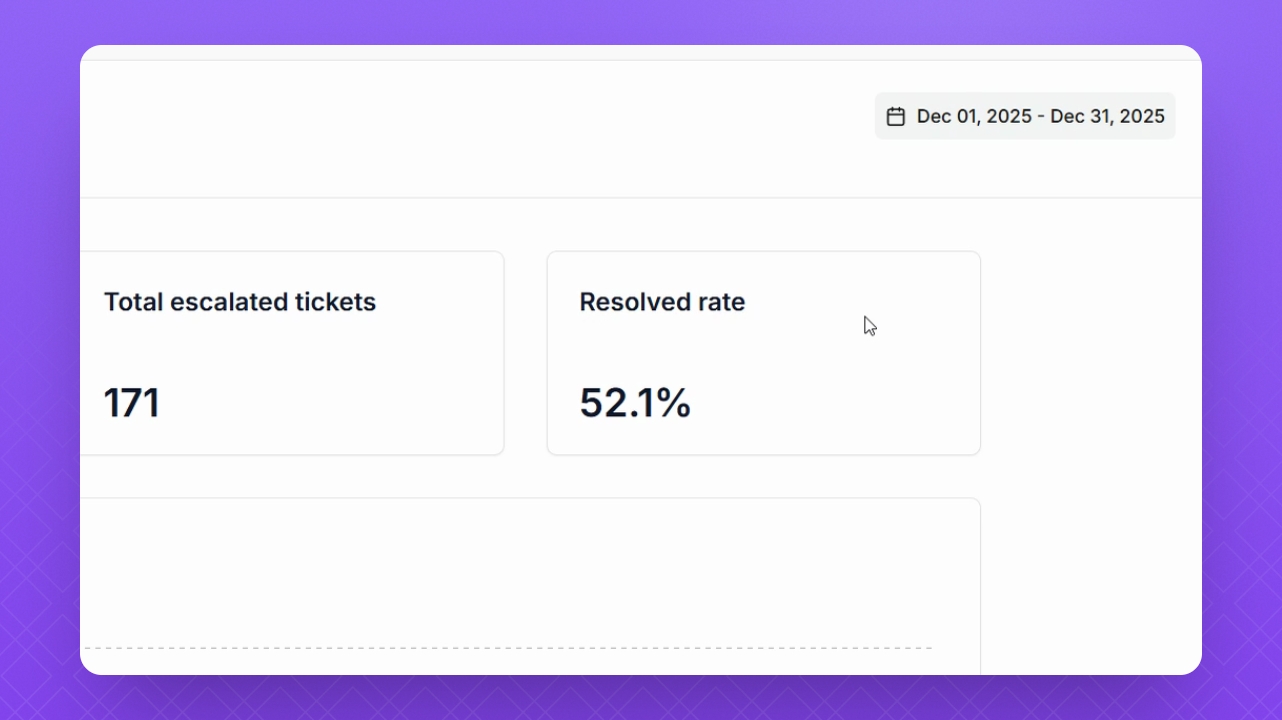
Step 2: Set Date Range
Use the Date Range filter in the top right corner to filter performance statistics by time period.
Step 3: Review Total Chats
Check the Total Chats metric to see the number of user conversations created by your Helply agent during the selected time.
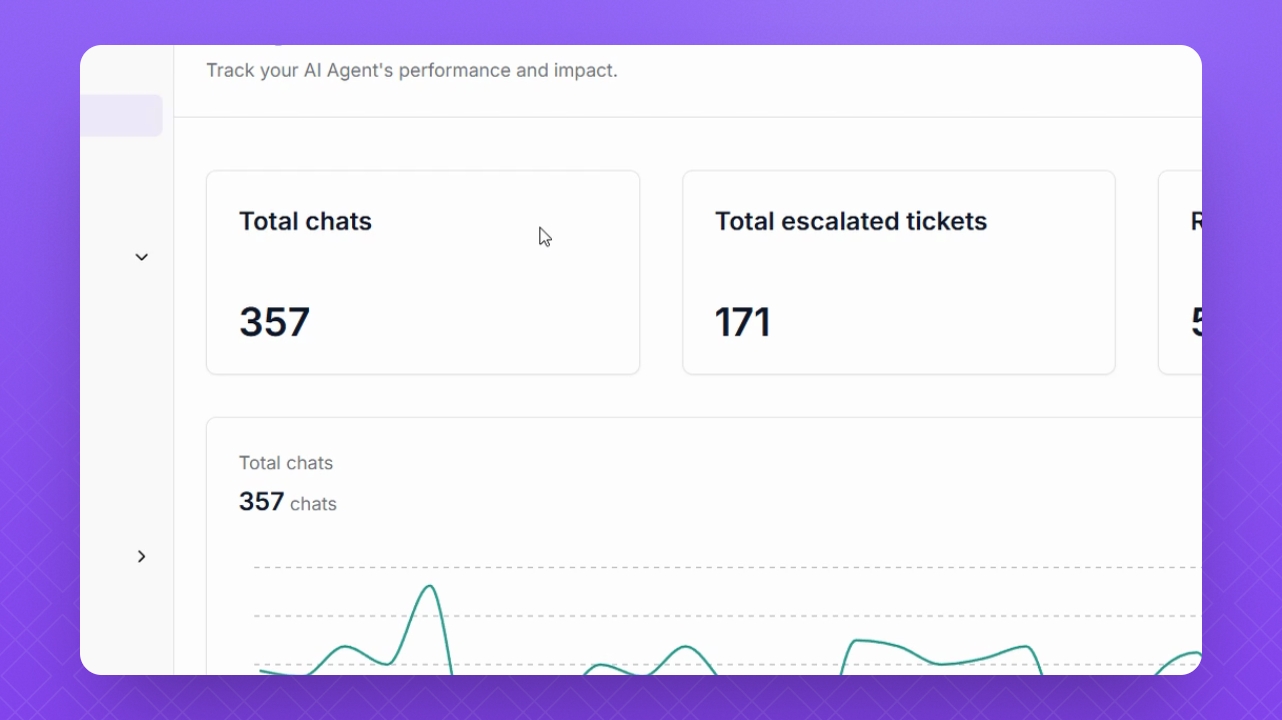
Step 4: Analyze Escalated Tickets
Look at the Total Escalated Tickets to understand how many queries were escalated to your support team.
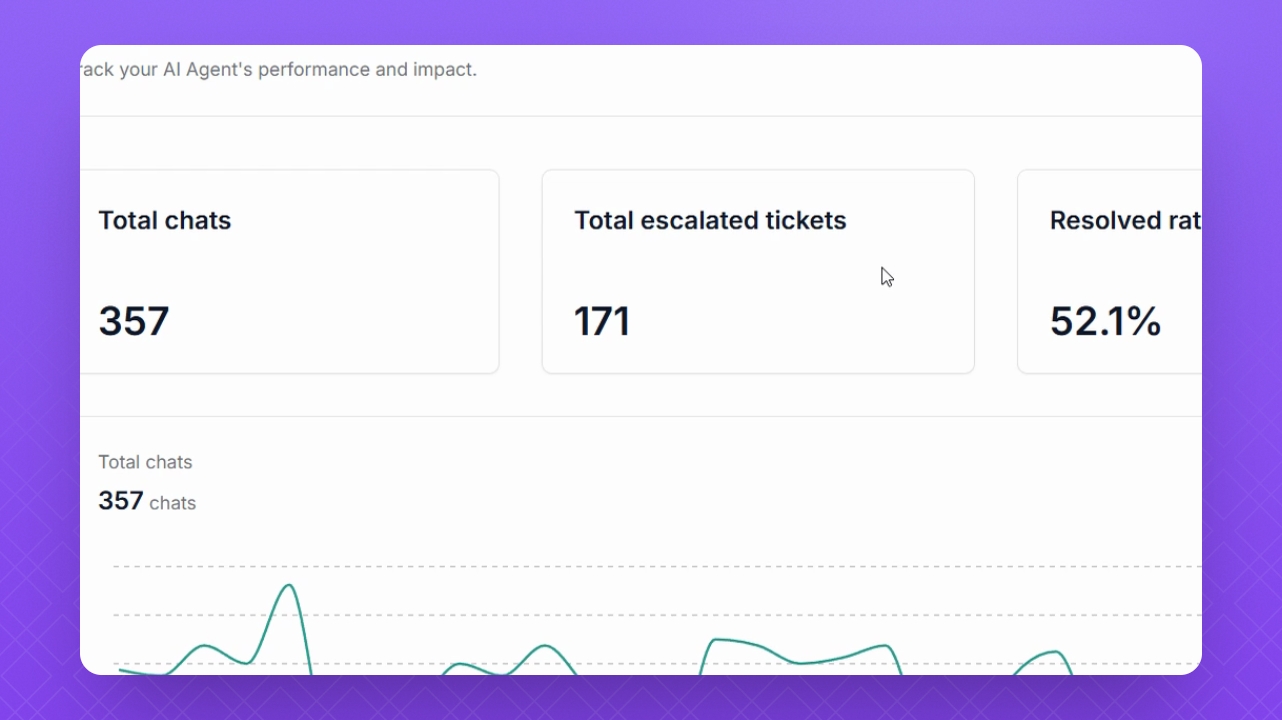
Step 5: Check Resolved Rate
Review the Resolved Rate to see how many users received answers without escalating their queries.
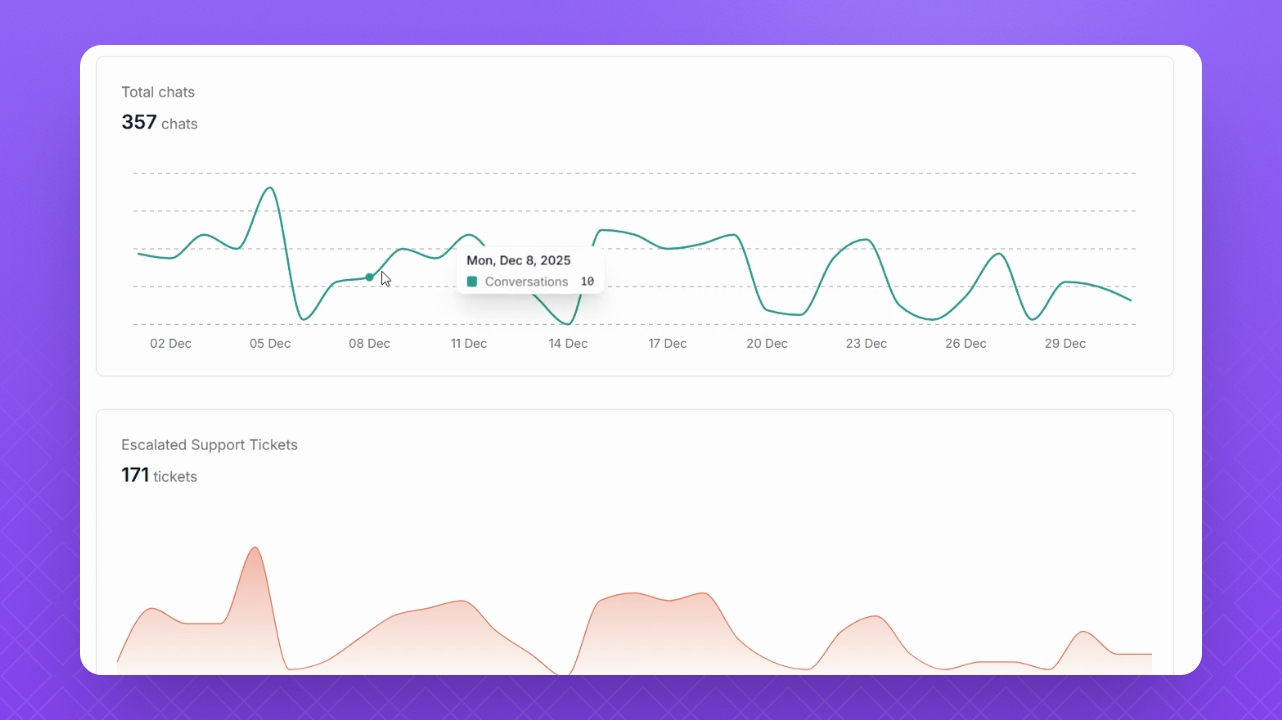
Step 6: View Performance Graphs
Below the metrics, observe the graphs illustrating your performance stats for Total Chats, Escalated Support Tickets, and Resolution Rate.